
 A correlation is a statistical measure of the relationship between two variables. The measure is best used in variables that demonstrate a linear relationship between each other. The correlation coefficient is a value that indicates the strength of the relationship between variables. The coefficient can take any values from -1 to 1.
The interpretations of the values are:
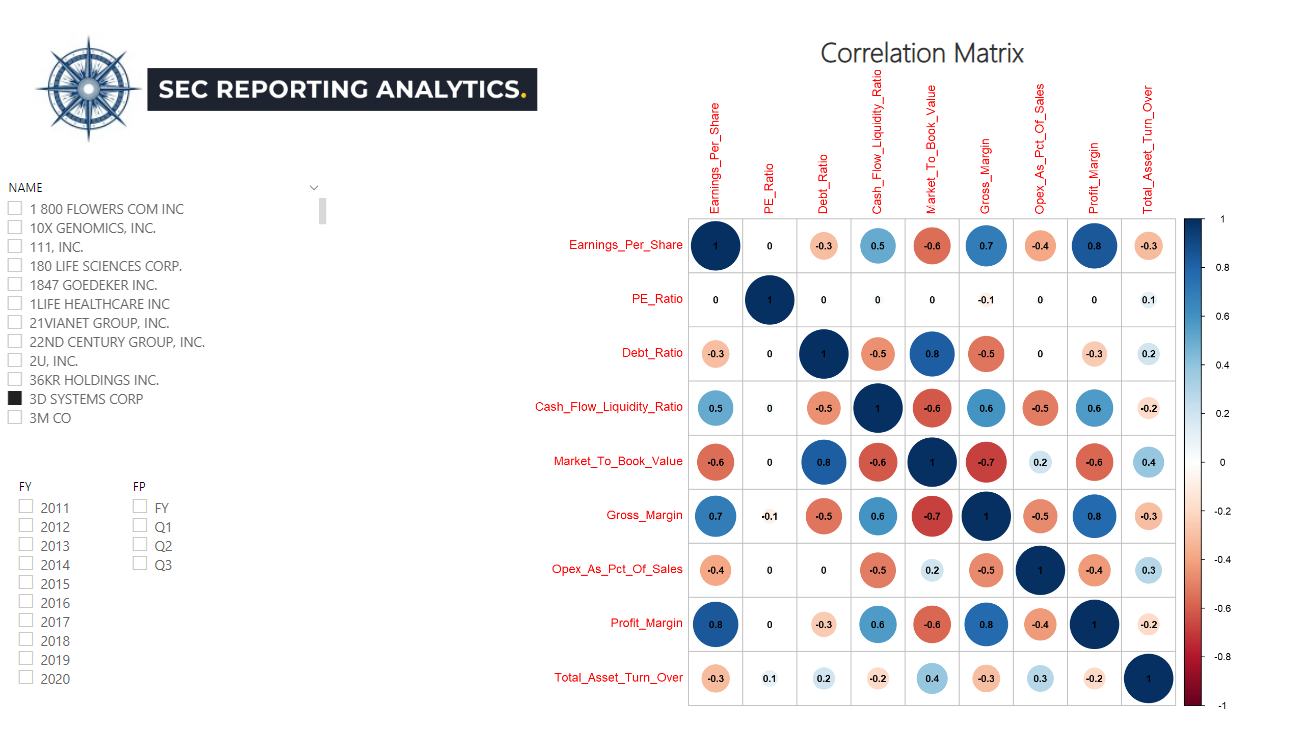
In the above correlation matrix we prepared using our data set of over 50 key fundamental financial metrics, we ran the correlations between a few key fundamental financial metrics to understand their impact on Earnings Per Share. We chose 3D Systems Corp in our analysis. As you can see, over the last 10 years, Earnings Per Share has a positive correlation between Cash Flow Liquidity, Gross Margin, and Profit Margin and a negative correlation between Debt Ratio, Operating Expense as a % of Sales, and Total Asset Turnover. Since each company will have its own correlation matrix, it's critical for portfolio and investment managers to incorporate these profiles into their asset allocation and risk mitigation strategies. In order to calculate the correlation coefficient you must undertake the following steps:
As you can see, the manual calculation of the correlation coefficient is an extremely tedious process, especially if the data sample is large. However, with SEC Reporting Analytics data set, now available Snowflake Data Marketplace, you don't need to spend hundreds of thousands of dollars and several years to develop quality quant financial training data. Your current team of data scientists, analytics managers, and portfolio managers can begin developing their own custom correlation, regression, and predictive analysis TODAY! We also provide ad-hoc correlation requests for individual tickers or a basket of tickers. Contact [email protected] with your requests. We look forward to hearing from you! Credit: SEC Reporting Analytics Corporate Finance Institute
3 Comments
8/23/2021 09:53:46 am
This was an extremely nice post. Taking a few minutes and actual effort to generate a top notch article 1/5/2022 02:36:30 am
ICON Legal Services - Our lawyer’s assist you do the right thing and provide you guidance to report fraud against banks, financial institutions. Consult today! 7/12/2022 11:35:04 am
オフショア 開発 と は , ITオフショア開発チーム, オフショア開発 , オフショア 開発 メリット, オフショア 開発 会社, オフショア 開発 システム 開発 , アプリ 開発 オフショア , ゲーム アプリ オフショア 開発 , オフショア アプリ 開発, オフショア 開発 費用 Leave a Reply. |

DATA Community NewsResearch & Development FAQs Archives
December 2021
Categories |
 RSS Feed
SEC REPORTING ANALYTICS 2016-2023 COPYRIGHT ALL RIGHTS RESERVED. All parties receiving or reviewing this website and analytics information provided by SEC Reporting Analytics LLC agree information will be kept strictly confidential, will not be shared with any 3rd party, and will not be replicated in attempts to compete with creator of original content.