|
If you are an investment adviser, hedge fund or active trader looking for the edge that good research can give you, you might turn to "alternative data providers" as investment professionals refer to any intelligence that isn't contained in traditional financial reports. There are over 450 vendors in this sector according to AlternativeData.org. Some providers offer satellite photos of parking lots to help predict whether retailers will blow-away Holiday shopping season estimates, others look for weather patterns' impact on commodity prices, or do sentiment analysis on corporate earnings calls, or gather any number of indicators available through big data and the Internet of Things (IoT). It's all fair game to trade smarter and be a step ahead of others in the marketplace.
Or is it really all fair game? Not so fast, Speedy, says the U.S. Securities and Exchange Commission that regulates trading in public companies' stock. In an enforcement action against App Annie, the leading alternative data provider that tracks downloads and usage of mobile apps, the regulator issued a $10 million fine against the company, a $300,000 fine against its CEO and banned him from serving as a company officer for 3 years. Where App Annie went wrong is that it lied to the tech company clients whose apps it tracked by saying it would anonymize and protect their usage data, then sold this information to other clients who were Walls Street investors hoping to profit from insights about which apps were doing well. Since some of the app makers were publicly traded companies, the information gathered under false pretense was deemed to be fraudulently gathered insider information. It wasn't only App Annie that engaged in criminal conduct by deceiving both sides: those app makers whose information was sold, and those who bought information they were told was derived from a statistical model. By trading while in possession of material non-public information, everyone who used the illegally obtained and shared data was unwittingly guilty of violating U.S. securities law anti-fraud provisions and risked fines, criminal penalties and a regulatory blemish on the public record. As it turned out in this case, none of the traders and investment managers who were clients of App Annie faced sanctions or were targeted for enforcements, however, the SEC has announced it will issue a Risk Alert to communicate additional guidance and spell out expectations of regulated firms on the topic of alternative data. The headshot it fired at App Annie will serve as a warning shot to all others. What will this mean if you are an active trader, hedge fund or investment adviser planning to use alternative data? It means that you will likely need to take a close look and exercise due diligence on the reputation, policies and internal controls of the companies you source data from to ensure that they are preventing the use and sharing of illegally obtained or material non-public information. You will also want to have an iron-clad contract where you provider promises that they have not done anything that would cause you to breach the laws on insider trading and use of illegally obtained information. As tempting as it is to get ahead of the competition by any means necessary, some of those means entail risk of serious harm to your firm for crossing the line into unethical or illegal behavior. What will this mean if you are an alternative data provider? You can expect that your potential financial services clients, at least the ones who aren't clueless knuckleheads, are going to be asking a lot more questions when they are evaluating your service. They will inspect your policies and your terms of service. They may ask for audit reports and to evaluate your internal controls. They will seek contractual terms whereby you attest to high ethical standards and clauses that indemnify them if you breach your agreements, The cost of doing business for your industry will include the cost of building compliance controls, carrying additional liability insurance and generally there will be no free ride, except a very short and bumpy one. We discussed the above post with James Taylor, Founder/CEO for SEC Reporting Analytics (not affiliated with the Securities and Exchange Commission) and he explained the approach they have taken, which we might see more of from other providers in the space: "Given the risks involved in any dealing with material non-public information, SEC Reporting Analytics has chosen to limit our offering to only handling data sourced from public sources, such as the SEC’s own published reports, and adding value to that data by analytical means only. We apply various tools such as data scraping, aggregation, and calculation of financial and operational key performance indicators and believe that the format we present to our clients will save them countless hours to get data that would normally be buried in various static PDF reports into a ready-for-analytics purpose state. Our partnership with Snowflake lets us give our clients access to enterprise grade cloud data & analytics tools such as Amazon FinSpace, Python, SQL, and traditional statistical models that can be used to understand the correlation between stock price and various underlying fundamental metrics over time. Our dataset outputs have been reconciled back to SEC filings over that last 5 years and can be customized to add new metrics based on client need. Whether you are a one-person compliance attorney, a large law firm that has a limited technology budget, or a portfolio manager looking for ways your team can quickly develop, test, and validate custom portfolio construction methodologies, SEC Reporting Analytics datasets will allow you and your team to quickly and efficiently identify and capture significant value for your firm." We welcome comments and questions from readers on this topic and will give an update on this topic when additional regulatory guidance or significant news comes to our attention. Article reposted with permission from FiClub.org.
0 Comments
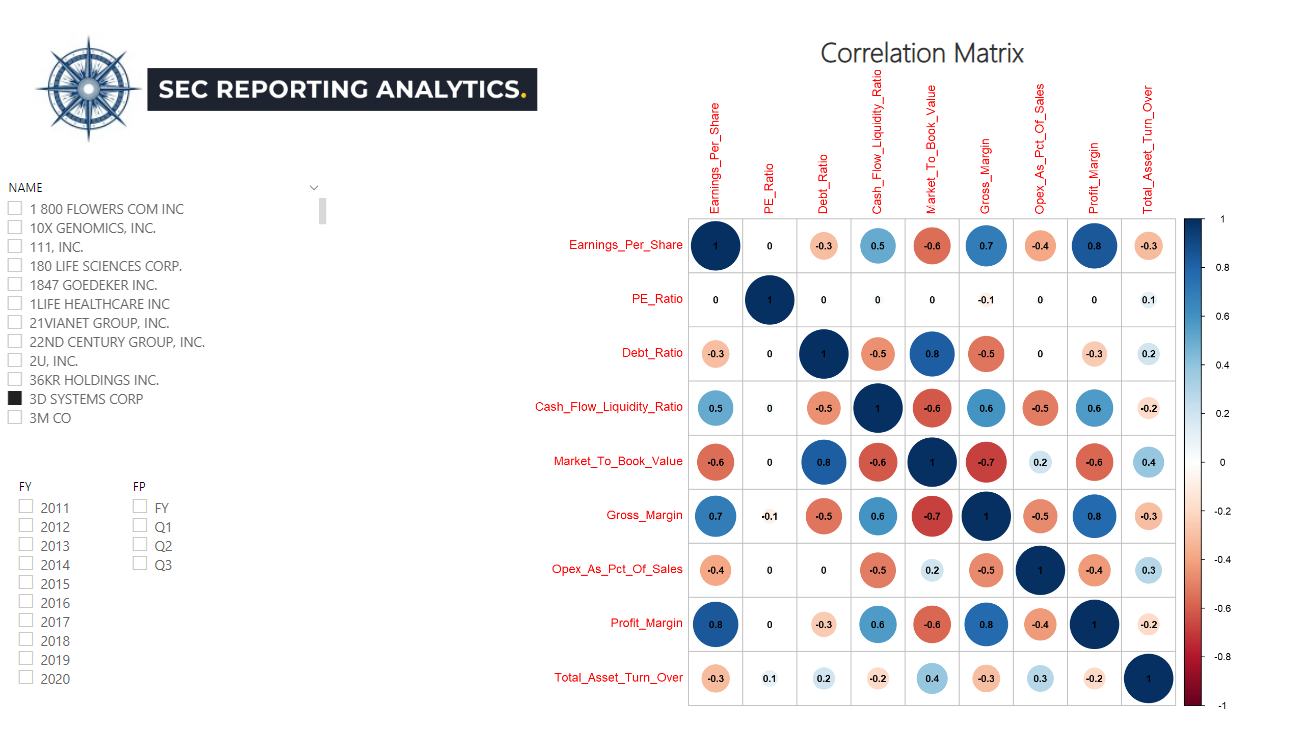
A correlation is a statistical measure of the relationship between two variables. The measure is best used in variables that demonstrate a linear relationship between each other. The correlation coefficient is a value that indicates the strength of the relationship between variables. The coefficient can take any values from -1 to 1.
The interpretations of the values are:
In the above correlation matrix we prepared using our data set of over 50 key fundamental financial metrics, we ran the correlations between a few key fundamental financial metrics to understand their impact on Earnings Per Share. We chose 3D Systems Corp in our analysis. As you can see, over the last 10 years, Earnings Per Share has a positive correlation between Cash Flow Liquidity, Gross Margin, and Profit Margin and a negative correlation between Debt Ratio, Operating Expense as a % of Sales, and Total Asset Turnover. Since each company will have its own correlation matrix, it's critical for portfolio and investment managers to incorporate these profiles into their asset allocation and risk mitigation strategies. In order to calculate the correlation coefficient you must undertake the following steps:
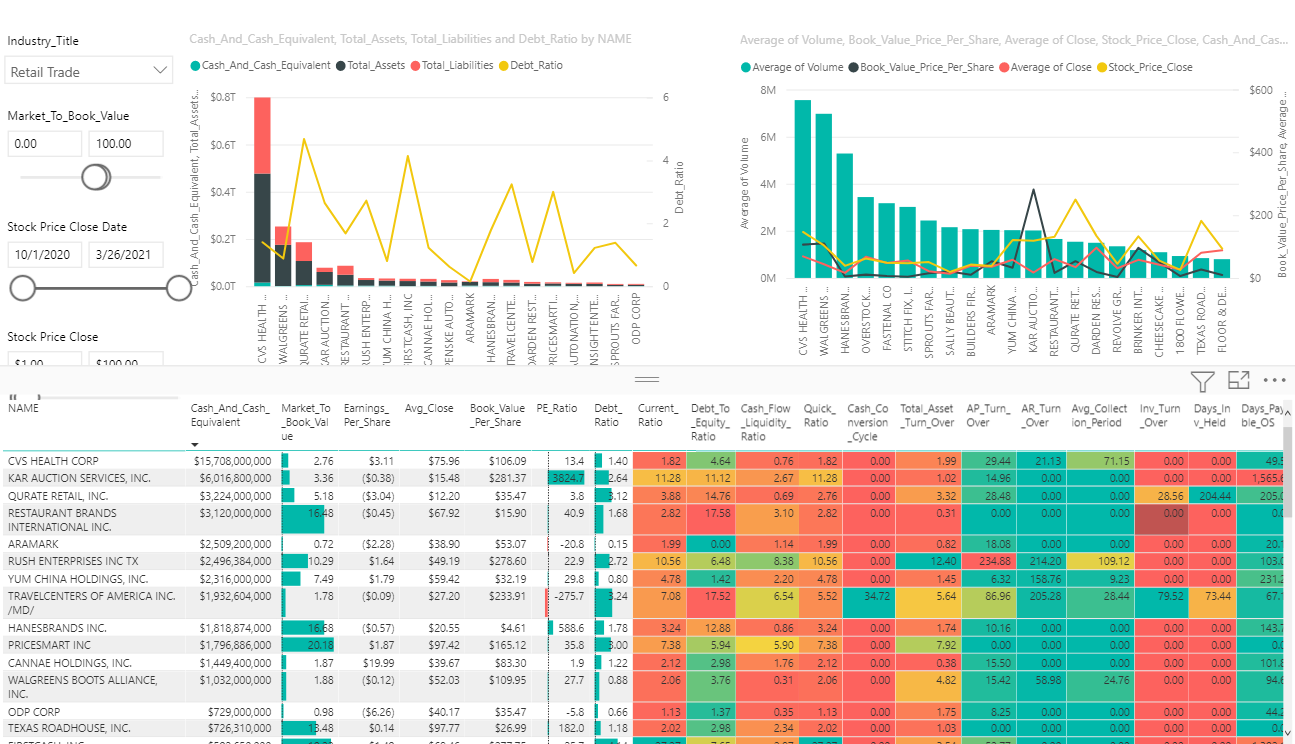
As you can see, the manual calculation of the correlation coefficient is an extremely tedious process, especially if the data sample is large. However, with SEC Reporting Analytics data set, now available Snowflake Data Marketplace, you don't need to spend hundreds of thousands of dollars and several years to develop quality quant financial training data. Your current team of data scientists, analytics managers, and portfolio managers can begin developing their own custom correlation, regression, and predictive analysis TODAY! We also provide ad-hoc correlation requests for individual tickers or a basket of tickers. Contact support@secreportinganalytics.com with your requests. We look forward to hearing from you! Credit: SEC Reporting Analytics Corporate Finance Institute Retail industry stock prices as of 3/26/2021 are higher than the average stock price since the start of Q42020. Market-to-book values for many firms within the industry are trading under 3x, including CVS Health ($CVS) and Aramark ($ARMK), both of which have several billions of dollars in cash on hand. The M/B ratio compares a company’s market value to its book value. The market value of a company is its share price multiplied by the number of shares outstanding. The book value is the net assets of the company. A lower M/B ratio could mean stocks are undervalued. However, it could also mean something is fundamentally wrong with the company. The P/B ratio also indicates whether you’re paying too much for what would remain if the company went bankrupt immediately. The P/B ratio has been favored by value investors for decades and is widely used by market analysts. Traditionally any value under 1 is considered a good P/B for value investors, indicating a potentially undervalued stock. However, value investors may often consider stocks with a P/B value under 3 as their benchmark. What counts as a “good” price-to-book ratio will depend on the industry in question and the overall state of valuations in the market. For example, between 2010 and 2020 there was a steady rise in the average price-to-book ratio of the technology companies listed on the Nasdaq stock exchange, roughly tripling during that period. An investor assessing the price-to-book ratio of one of these technology companies might therefore choose to accept a higher average price-to-book ratio, as compared to an investor looking at a company in a more traditional industry in which lower price-to-book ratios are the norm.
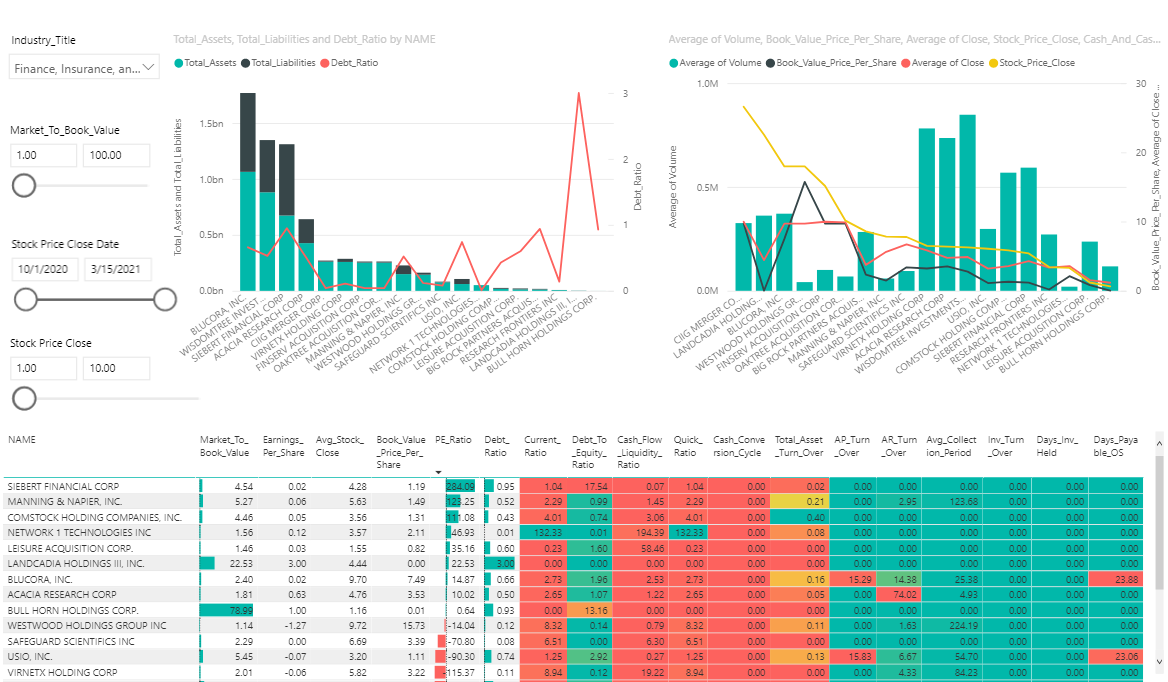
Example: Assume that a company has $100 million in assets on the balance sheet and $75 million in liabilities. The book value of that company would be calculated simply as $25 million ($100M - $75M). If there are 10 million shares outstanding, each share would represent $2.50 of book value. If the share price is $5, then the P/B ratio would be 2x (5 / 2.50). This illustrates that the market price is valued at twice its book value. Please also connect with our social media pages for future market opinions, picks, and insights. Twitter @SECReporting LinkedIn @SECReportingAnalytics Access SEC Reporting Analytics dataset on Snowflake today to perform your own analysis and insights to share with us here on our community page. Credit: SEC Reporting Analytics Investopedia Finance, Insurance, and Real Estate industry stock prices as of 3/15/2021 are higher than the average stock price since the start of Q42020. Market-to-book values for many firms within the industry are trading under 3x, including Network 1 Technology INC ($NTIP) and Acacia Research Corp ($ACTG), both of which are also generating positive EPS(Earnings Per Share) for investors. The M/B ratio compares a company’s market value to its book value. The market value of a company is its share price multiplied by the number of shares outstanding. The book value is the net assets of the company. A lower M/B ratio could mean stocks are undervalued. However, it could also mean something is fundamentally wrong with the company. The P/B ratio also indicates whether you’re paying too much for what would remain if the company went bankrupt immediately. The P/B ratio has been favored by value investors for decades and is widely used by market analysts. Traditionally any value under 1 is considered a good P/B for value investors, indicating a potentially undervalued stock. However, value investors may often consider stocks with a P/B value under 3 as their benchmark. What counts as a “good” price-to-book ratio will depend on the industry in question and the overall state of valuations in the market. For example, between 2010 and 2020 there was a steady rise in the average price-to-book ratio of the technology companies listed on the Nasdaq stock exchange, roughly tripling during that period. An investor assessing the price-to-book ratio of one of these technology companies might therefore choose to accept a higher average price-to-book ratio, as compared to an investor looking at a company in a more traditional industry in which lower price-to-book ratios are the norm.
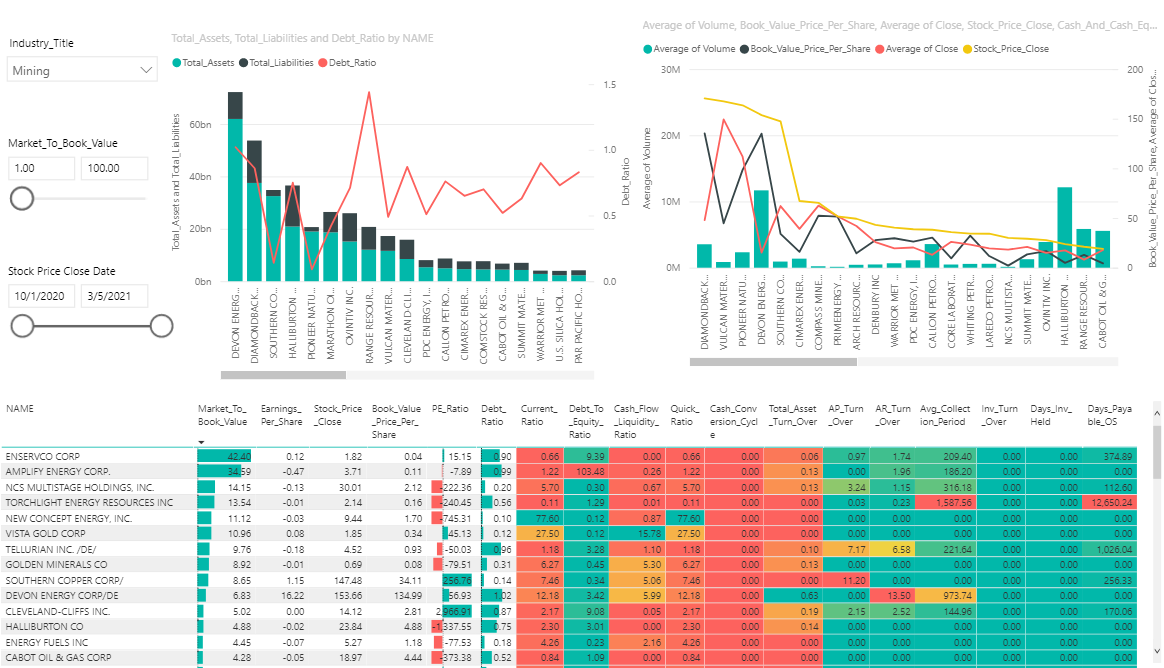
Example: Assume that a company has $100 million in assets on the balance sheet and $75 million in liabilities. The book value of that company would be calculated simply as $25 million ($100M - $75M). If there are 10 million shares outstanding, each share would represent $2.50 of book value. If the share price is $5, then the P/B ratio would be 2x (5 / 2.50). This illustrates that the market price is valued at twice its book value. Please also connect with our social media pages for future market opinions, picks, and insights. Twitter @SECReporting LinkedIn @SECReportingAnalytics Access SEC Reporting Analytics dataset on Snowflake today to perform your own analysis and insights to share with us here on our community page. Credit: SEC Reporting Analytics Investopedia Precious Metals & Energy industry stock prices as of 3/5/2021 are higher than the average stock price since the start of Q42020. Further, price-to-book values for many firms within the industry are trading under 3x, some as high as 40x. The P/B ratio compares a company’s market stock price to its book value. The market value of a company is its share price multiplied by the number of shares outstanding. The book value is the net assets of the company. A lower P/B ratio could mean stocks are undervalued. However, it could also mean something is fundamentally wrong with the company. The P/B ratio also indicates whether you’re paying too much for what would remain if the company went bankrupt immediately. The P/B ratio has been favored by value investors for decades and is widely used by market analysts. Traditionally any value under 1 is considered a good P/B for value investors, indicating a potentially undervalued stock. However, value investors may often consider stocks with a P/B value under 3 as their benchmark. What counts as a “good” price-to-book ratio will depend on the industry in question and the overall state of valuations in the market. For example, between 2010 and 2020 there was a steady rise in the average price-to-book ratio of the technology companies listed on the Nasdaq stock exchange, roughly tripling during that period. An investor assessing the price-to-book ratio of one of these technology companies might therefore choose to accept a higher average price-to-book ratio, as compared to an investor looking at a company in a more traditional industry in which lower price-to-book ratios are the norm.
Example: Assume that a company has $100 million in assets on the balance sheet and $75 million in liabilities. The book value of that company would be calculated simply as $25 million ($100M - $75M). If there are 10 million shares outstanding, each share would represent $2.50 of book value. If the share price is $5, then the P/B ratio would be 2x (5 / 2.50). This illustrates that the market price is valued at twice its book value. Please also connect with our social media pages for future market opinions, picks, and insights. Twitter @SECReporting LinkedIn @SECReportingAnalytics Access SEC Reporting Analytics dataset on Snowflake today to perform your own analysis and insights to share with us here on our community page. Credit: SEC Reporting Analytics Investopedia Disclaimer: Information contained in this report are only opinions and only provided for research purposes and not investment advice. Stocks, commodities, securities, and such are all very similar when it comes to trading. We buy, we sell, we hold. All this in order to make a profit. The question is: How can Data Science help us when it comes to making these trades on the stock market?
Credit: Towards Data Science and Marco Santos Ratios can be invaluable tools for making decisions about companies you might want to invest in. Across the industry, they are used by individual investors and professional analysts, and there are a variety of ratios to use. Financial ratios are typically cast into four categories.
Credit: Investopedia and Jonas Elmerraji Great research article posted on Analytics Vidhya on correlating stock price performance and financial ratios. With our unique data set, you can begin integrating this research and more into your long and short term trading strategies. We are here to help as much or as little as you need.
Happy Investing!! Credit: Analytics Vidhya and Gaurav Khatri |
DATA Community NewsResearch & Development FAQs Archives
December 2021
Categories |
SEC REPORTING ANALYTICS 2016-2023 COPYRIGHT ALL RIGHTS RESERVED. All parties receiving or reviewing this website and analytics information provided by SEC Reporting Analytics LLC agree information will be kept strictly confidential, will not be shared with any 3rd party, and will not be replicated in attempts to compete with creator of original content.


 RSS Feed